Cloud-based Freight Dashboard
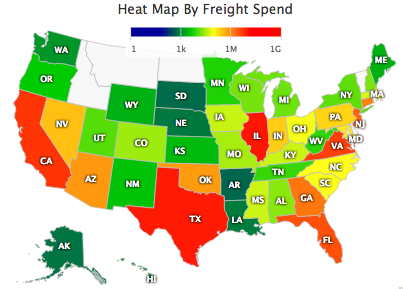
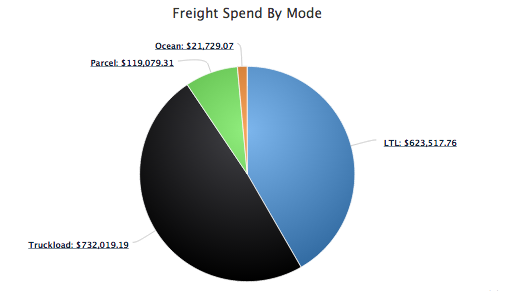
View all of your Key Performance Indicators (KPIs) in one place with our Freight Dashboard to understand the components of your freight spend. Select a date range and analyze your freight by mode, direction, terms, and warehouse. Data are presented both in terms of dollars spent as well as tonnage shipped. Download data and charts in multiple formats for further analysis or use in presentations.
The freight dashboard is included as part of our freight payment services. It is also available in conjunction with parcel audit services and our online rate shopper. Even CalcRate clients can transfer accrual or history files to take advantage of this service. |
 |
 |
Views include:
|
![]()